Description
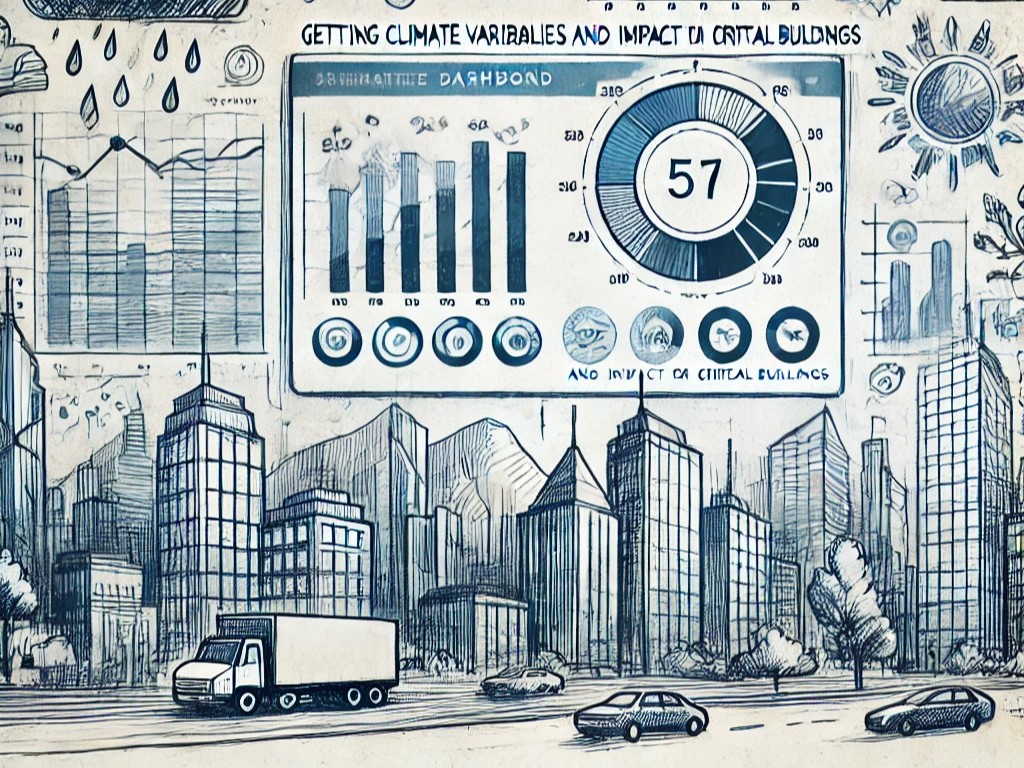
"Assessing Risk of Extreme Weather on Facilities Maintenance" is an interactive tool designed to analyze and visualize the impact of climate variables on critical infrastructure in Hamilton, Ontario. The dashboard combines maintenance cost data with weather variables to identify which buildings are most vulnerable to climate change and how budget allocation should evolve over time.
Built so that judges, managers and city planners could explore the data interactively — drill down by ward, filter by climate variable, and project future scenarios.
Tools and Technologies
- Looker Studio — interactive front-end and storytelling layer
- BigQuery — data warehouse for climate + maintenance datasets
- SQL — feature engineering and aggregation queries
- Geospatial mapping — vulnerability heatmaps by ward
Why this dashboard mattered
By turning a static dataset into a living tool, we gave judges and stakeholders a concrete way to interrogate the data. This was a key differentiator that helped our team stand out in the final round of the HEAD Competition.
Want to see the live dashboard?
Open in Looker Studio