
Recognized as HEAD Competition Winners
One of the most significant achievements in my professional career was winning the Higher Education Analytics Data Competition (HEAD), organized by Mohawk College in Canada. This prestigious annual competition brings together teams of analysts and data professionals to solve critical problems in managing educational institutions, using advanced analytical and modeling tools.
The experience not only marked a milestone in my career but also challenged my skills in leadership, data analysis, and teamwork.
What is the HEAD competition?
The HEAD Competition is an annual event where students from colleges and universities apply analytical techniques to solve real-world challenges. The 2024 edition focused on assessing the impact of climate change and extreme weather on the maintenance and resilience of the City of Hamilton's facilities.
A Three-Phase Competition
Phase 1 · Initial proposal (80 teams)
80 teams competed; only 24 advanced to the second stage. Evaluation focused on the quality and depth of the analytical proposal.
Phase 2 · Poster & semifinal (24 → 8)
Semifinalist teams presented a poster summarizing analyses and preliminary findings. Only 8 teams advanced.
Phase 3 · Finals & live defense (8 → 1)
Finalists delivered a live presentation before a panel of judges, defending their work and demonstrating impact.
The Key to Success
The success of this competition was driven by a clear division of responsibilities within the team, ensuring each member contributed their expertise effectively:
- Anja: Led the economic analysis and played a crucial role in improving visualizations.
- Yairo & Daniel: Focused on sourcing climate data from reliable sources and provided general support on presentations.
- Edwin (Me): Took charge of data processing, assigning tasks, and designing the overall data strategy, ensuring alignment across all aspects of the project.
This structured approach not only streamlined our workflow but also ensured that the strengths of each team member were maximized.
Integrating Data to Solve a Complex Problem
The 2024 HEAD Competition tasked participants with assessing the impact of climate change and extreme weather on the maintenance and resilience of the City of Hamilton's facilities. The goal was to develop proactive maintenance strategies that ensure facility resiliency, reduce downtime, and integrate climate considerations into long-term investment plans.
The dataset provided included information about buildings in Hamilton, Ontario: their FCI Rating, associated maintenance costs, and the investment needed to restore them. The main challenge was integrating this information with external climate data to analyze how weather conditions affected the deterioration of buildings.
Our analytical approach
- Collecting Climate Data: Specific climate data from each area in Hamilton, averaging the most relevant variables to represent weather conditions near each building.
- Linking Data to FCI Rating: Linking this data to the FCI Rating, creating a detailed analysis that demonstrated the relationships between climate variables and maintenance costs.
- Predicting Climate Data: Projecting future climate scenarios to predict how maintenance needs might evolve under different conditions.
Adding value to our proposal
While we were initially tasked with creating an informative poster, we also decided to include an interactive dashboard. This allowed judges and attendees to view, filter, and interact with the data dynamically.

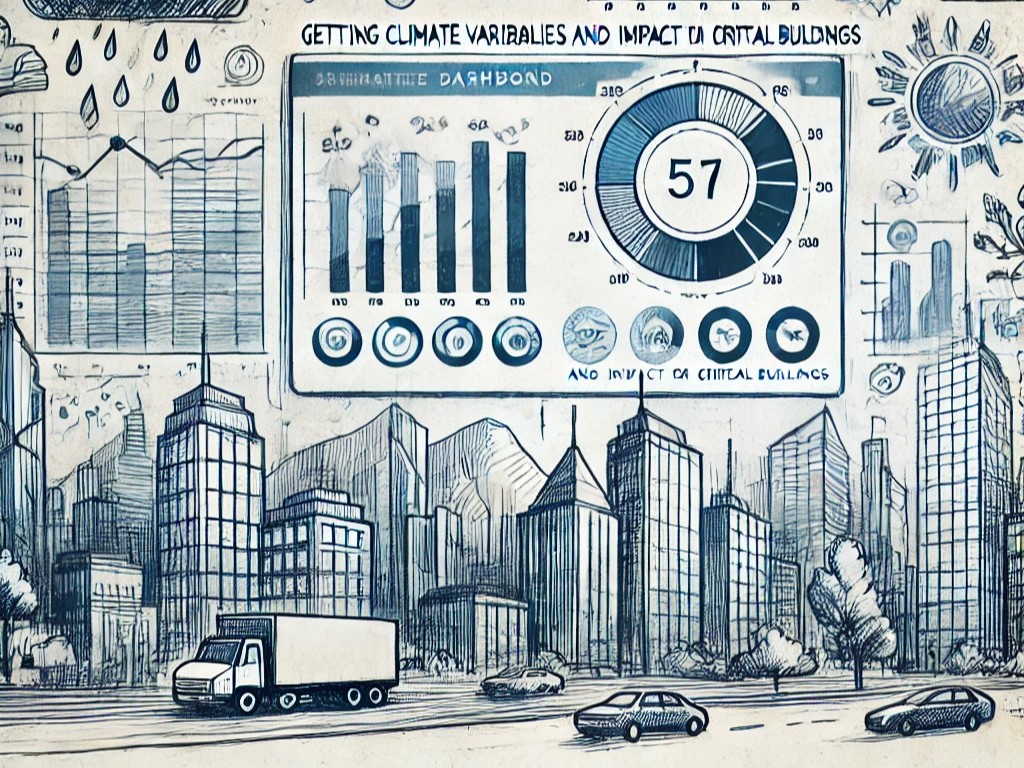
- Poster Presentation: Methodology, analysis and findings — including visualizations that demonstrated how climate variables impact facility maintenance.
- Interactive Dashboard: Dynamic dashboard with maps showing the vulnerability of city wards, FCI distribution and climate sensitivity drilldowns.
A Milestone Achievement
Winning the HEAD Competition was an immensely enriching experience. I gained valuable lessons in leadership, data strategy, and teamwork. This achievement reinforced my ability to lead challenging projects, bring people together around a clear goal, and translate complex data into stories that drive decision-making.
Want to see the interactive dashboard or the next project?
See Environmental Impact Dashboard